I have been thinking for a while if there would be something – anything! – that I could write about that people might actually be interested in. Then I thought about what I like and what I am actually good at (spoiler: not much!), but eventually it all fell into place. Each triathlon race produces a vast amount of data and there are plenty of interdependencies between disciplines, ages and gender that it might prove an interesting to dive a bit deeper into the data after a race. I´ve always been a fan of data and proper rational analysis and love to run some analysis of my own races, so why not share it with you?
I don´t know yet what exactly I am looking for or what people might be interested in so for now I´ll just jump right in and see where the journey will take us. That´s the beauty of all this, we´ll just see what comes along and pick up topics for further inspection along the way.
I will start this week with a race that is on top of my list, the Ironman 70.3 in Ruegen, Germany. Ruegen is a small island in the baltic sea and hosts one of the last 70.3 races on Ironman´s calendar in Europe. This year Patrick Lange and Anja Beranek took the win, Patrick showing he is in form for Kona. I am not sure whether Anja is having ambitions for Kona, but she hauled ass, too! Patrick finished in a for most age groupers otherworldly 3:43:46, Anja´s time of 4:16:37was likewise beyond imagination.
But how did the age groupers fare? Is Ruegen a fast course? Was it competitive? Which leg was the most decisive? Let´s find out!
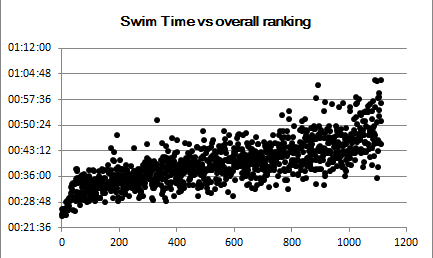
Let us start with the overall ranking and times of all athletes across all age groups. The scatter plots show the rank and swim / bike / run time of each individual athlete. The more orderly the dots are grouped together, the lesser the correlation of the doscipline with an athletes overall result. A note for later, I shall figure out how to properly quantify this. For now we can just say that a correlation of 1 (perfect correlation, meaning the ranking of a single discipline perfectly reflects the overall result) would produce a perfectly ordered plot, while zero correlation would produce a perfectly chaotic one. Working with these soft or qualitative measurements we can still see that – surprise, surprise – the bike leg had the greatest influence on your result, while in the swim you could get away with a relatively poorer result and still finish strong. That being said, naturally there is still very little room for slacking at the very pointy end, evident by the steep and sharp edge of the plot at the furthest left.


So until I´ve figured out the math of a quantitive measurement of single-discipline decisiveness we move on to the next big question: How competitive was the race and what did it take to grab a trophy? At first sight there are several headlines, and I personally like none of those. The most depressing (or depending on your age, uplifting) news is that people hardly slow down with age. Look at the plot, showing the times of each age groups top 3 (Left to right F18, F25, …, F60, M18, M25, …, M65, Pro-M, Pro-F) which shows barely any difference between M18 and M50! You would need to stay well below 4:30 to podium any of these. So if your plan was to wait until you enter the next age group to attack, don´t bother. Also, almost all AGs are fairly competitive with only little space between the contenders.

And how does it look for each discipline individually? Well, check it out below! A few things appear interesting enough for further investigation once we have more data. For the swim there appears an odd clear cut of best times – except the Pro men all age groups hit a barrier around 29 minutes. Performance fades with ages in both genders, but overall the swim is where fast age groupers are the most equal.

The interesting bit about the bike is that there appears to be a low point at around M40 – indicating that the male bike race becomes even more competitive with age! There is a hint of this tendency for the women, too, but it is much less pronounced and deserves no attention at this point.

Finally, the run. Interestingly we see that the AG spots are more spread out, while both pro fields are packed very close together. There is a slight upward trend with age beyond 45. Also worth noting is that it is on the run where age groupers come closest to the pro field. There was a clear division after the swim and s smaller but existing gap on the bike. On the run, top age groupers knock on the door of the pro podium. Another thing we should revisit once we have more data.

So, as I was hoping we´ve uncovered more questions than answers. For future reference I´ll write them down.
- How can we properly quantify the deciviness of a race?
- Where are the biggest gaps between pro´s and age groupers and why?
- Which age group is overall the strongest in each discipline?
That was fun. See you soon for more.
Leave a Reply