2017 is drawing to a close. And since I feel like crap and my quads are completely shot from our run on Wednesday I might as well start writing my annual recap. To make it short – 2017 was fantastic. I finished my first 70.3, crept up close to the podium in our local sprint series, developed my bike FTP like crazy and PR´ed my open half and marathon. Races in numbers:
- April, 70.3 Florida. First HIM in 5:11
- June, local 70.3. Only swim and bike because we couldn’t find a babysitter. Since April my swim (33 vs. 40 minutes) and bike (2:33 vs. 2:39) improved significantly.
- August, local sprint. Top 15 out of the water, less than a minute off my AG podium. didn’t push 100% because I was planning on another 70.3 two weeks later.
- October, PR on the open half marathon in 1:27:52, beating last year by almost a minute
- November, PR on the open marathon in 3:32:44, beating 2015 by almost 30 minutes
In total I spent 335 hours training and racing and accumulated 19.000 TSS. I averaged 365 TSS and 6 hrs 26 min per week, hit a minimum of 43 TSS / 50 min (NO ZERO!) and a max of 643 / 11hr 43 min. Overall 3097 TSS for swimming, 8645 biking and 7209 running. This graph shows my daily total TSS and 7-day moving average. I was periodizing for an A race in April and June and August and B-races in early August, September and October. Here you can see my daily TSS per discipline.
To keep track of my overall workout intensity I also looked for my average TSS per hour workout. Now this number is not the most precise or reliable piece of data, but it should give at least a rough indication of how hard I´ve been banging myself up. I´ve always thought of myself of the more short & hard kind of guy (yea, what she said) and this is probably the suitable metric to track my progress and compare myself against others. As I said, the data does not have mechanical precision for the following reasons:
- Since I don´t really do focused or precise speed work on the pool I assume a constant TSS/m for my swim workouts.
- For running TSS I am using a Strava plugin that calculates running TSS based on pace. As far as I understand it does not adjust for climbs and I am updating my half marathon pace not regularly.
Either way, the intensity over the had noticeable variation, averaging 58,6 and a max of 86,4 and min of 14. My TSS per hour graph shows the progression over the year.
Another thing worth noting is how awesome my FTP has progressed. I´ve started power based structured training in February and over the course of 10 months I´ve raised my threshold by 71%. The initial test didn’t´t go well, but even if we take my second assessment it is still 30% more. That is insane and I can´t wait to see what happens over the next 10 months! Before I gained 3 pounds over christmas I was sitting at 4.39 w/kg, which makes me wonder what I could achieve on the road if I focused solely on biking again. Anyway here is the graph in case you were wondering.
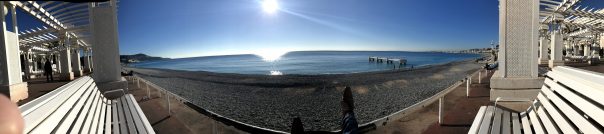
Major takeaways from this year? I don´t know, I learned so much. But the key learning was probably the realization that consistency is king. I spent all year having a goal in mind and working towards it. Sometimes more, sometimes less and rarely as much as people on the internet claim they are doing. Still my results are good and I am looking forward to another year of getting rowdy! To more fun, better results, greater experiences and of course, more exploring! As a final good bye to 2017, a picture I took Wednesday running up a hill nearby. We´ve said a million times “oh we gotta do this more often!” – For 2018 I´ll just say “I am going to do this more often!”.

Leave a Reply